Infographic Icon Time Chart for Vector Projects
Visualizing data effectively is one of the most significant challenges in modern design, especially when trying to communicate complex timelines or schedules. The Infographic Icon - Time Chart serves as a specialized visual tool designed to bridge the gap between raw data and audience comprehension. Rather than presenting dates and milestones as a dry list, this asset transforms chronological information into an engaging graphical narrative. For designers, marketers, and educators, it represents more than just a decorative element; it is a functional component that structures information logically while maintaining aesthetic appeal.
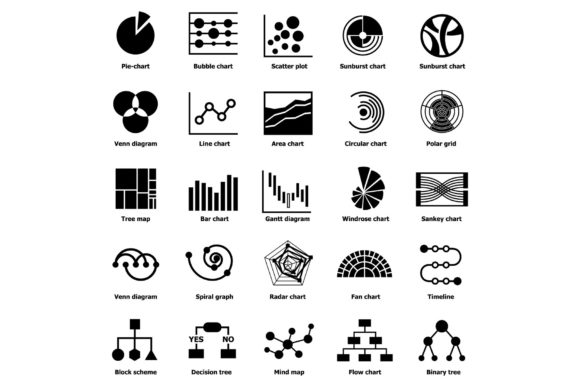
At its core, this resource is a collection of vector-based graphics specifically engineered for timeline presentations. Whether you are mapping out a company’s history, planning a project roadmap, or creating educational materials about historical events, these icons provide the visual scaffolding necessary to guide the viewer’s eye. The primary value lies in their versatility and technical quality. Because they are built as vectors, they maintain perfect clarity regardless of size, making them equally effective on a business card or a large-format banner. This scalability eliminates the common frustration of pixelation that often plagues raster-based design elements.
Why Vector Format Matters for Print and Digital
Understanding the technical specifications included with this package is essential for maximizing its utility across different media. The inclusion of 100 fully resizable vector files in EPS10 format is the standout feature for professional work. EPS10 is a widely compatible standard that works seamlessly with industry-standard software like Adobe Illustrator, CorelDRAW, and Affinity Designer. Unlike JPEGs or PNGs, which are made of fixed pixels, these vector files are constructed from mathematical paths. This means you can scale a time chart icon down to the size of a postage stamp or up to the size of a billboard without losing a single detail or sharp edge.
For those who may not have access to advanced vector editing software or simply need a quick reference, the package also includes a JPEG Preview at 300DPI. This high-resolution preview serves two practical purposes. First, it allows users to quickly browse and select the appropriate icon without opening heavy vector files. Second, the 300DPI resolution ensures that even the preview image is suitable for high-quality printing. Many printable projects, such as brochures, flyers, and annual reports, require a minimum of 300 dots per inch to look crisp on paper. Having this high-fidelity preview ready to use can save significant time during the initial layout and mockup phases.
Practical Applications Across Industries
The adaptability of the Infographic Icon - Time Chart extends far beyond corporate boardrooms. Its clean, modular design makes it suitable for a wide array of personal and professional contexts. Small business owners frequently utilize these assets to create "About Us" pages that visually narrate their brand's evolution. Instead of writing lengthy paragraphs about founding dates and expansion milestones, a horizontal or vertical time chart can convey the same information in seconds, improving user engagement and retention on websites.
Educators and academic professionals find immense value in these tools for curriculum development. History teachers can illustrate the progression of civilizations, while science instructors can map out biological life cycles or geological eras. Because the files are fully editable vectors, educators can customize colors to match school branding or simplify complex charts for younger students. Similarly, freelancers and consultants use these icons in proposals and case studies to demonstrate project management capabilities. Showing a potential client a clear, visualized workflow builds trust and demonstrates organizational competence more effectively than text alone.
- Corporate Reporting: Visualize quarterly growth, product development cycles, or strategic five-year plans in annual reports.
- Event Planning: Create clear itineraries for conferences, weddings, or festivals that guests can easily understand at a glance.
- Digital Marketing: Enhance blog posts and social media carousels with custom graphics that explain processes or histories.
- Personal Projects: Design family trees, travel itineraries, or personal goal trackers for planners and journals.
- Non-Profit Communication: Illustrate the impact of donations over time or the history of community initiatives for grant applications.
Customization and Creative Flexibility
One of the most compelling reasons to choose vector-based time chart icons is the freedom they offer in customization. When working with the EPS10 files, every element is typically separated into layers or groups. This structural organization allows users to change colors, adjust line weights, add or remove nodes, and integrate the icons with existing brand guidelines effortlessly. If your brand uses a specific shade of teal and coral, you can update the entire set of 100 icons globally in minutes rather than redesigning them from scratch.
This level of control also supports creative experimentation. You might combine multiple time chart elements to create a circular lifecycle diagram or a zigzagging process flow. The modular nature of these infographic icons encourages designers to mix and match components to solve unique layout problems. For printable projects specifically, this flexibility ensures that the final output matches the physical dimensions of the medium perfectly. You can stretch a timeline to fit a tri-fold brochure panel or condense it for a postcard without compromising the visual integrity of the design.
Key Considerations Before Implementation
While the Infographic Icon - Time Chart is a powerful resource, successful implementation requires thoughtful planning. Before diving into the design process, consider the hierarchy of information. A time chart should simplify complexity, not add to it. Select only the most critical milestones to display; overcrowding the graphic with too many data points will defeat its purpose. The goal is to provide a visual summary that complements detailed text, not to replace comprehensive documentation entirely.
Technical compatibility is another important factor. While EPS10 is a robust standard, ensure your chosen software supports it fully. Some older versions of design programs or free alternatives may interpret vector effects differently. It is always wise to open the file and check for any missing fonts or broken links before starting extensive edits. Additionally, when preparing files for print, remember to convert colors to CMYK mode if the printer requires it, even though the source files may be in RGB. The included 300DPI JPEG preview can serve as a reliable color proofing reference to ensure what you see on screen matches expectations for physical output.
Finally, consider accessibility when using these icons in digital formats. Vector graphics embedded in PDFs or websites should include alternative text descriptions. While the visual representation aids quick comprehension, screen reader users rely on textual equivalents to access the same information. Treating the Infographic Icon - Time Chart as part of a holistic communication strategy ensures that your designs are not only beautiful and scalable but also inclusive and effective for all audiences. By leveraging the precision of vector design and the convenience of high-resolution previews, creators can produce professional-grade visual content that stands the test of both time and technology.