Infographic Isometric Elements for Business Visuals
Transforming dense data into digestible visuals is one of the most persistent challenges in modern business communication. Whether you are preparing a quarterly financial report, pitching to venture capitalists, or explaining a complex workflow to new employees, flat text and standard bar charts often fail to capture attention. This is where Infographic Isometric Elements serve as a critical bridge between raw information and audience understanding. By utilizing three-dimensional geometric representations on a two-dimensional plane, these assets add depth, context, and professional polish to presentations that standard vector art simply cannot achieve.
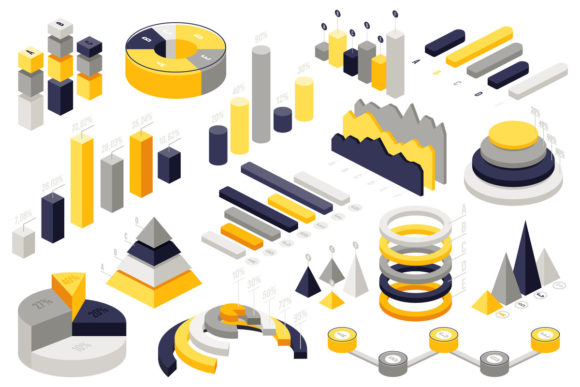
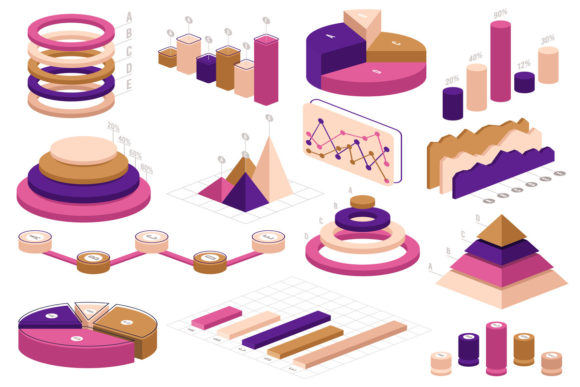
This specific collection is designed to function as a comprehensive choice set for creating professional business charts, diagrams, statistics, and financial concepts. Rather than offering generic clip art, these elements provide the structural building blocks necessary for high-level corporate storytelling. The isometric perspective creates a sense of order and technical precision, making it particularly effective for industries like fintech, logistics, SaaS, and urban planning where spatial relationships and systemic thinking are paramount.
The Strategic Advantage of Isometric Design
Isometric projection differs from traditional perspective drawing because it maintains parallel lines without vanishing points. This unique characteristic makes Infographic Isometric Elements exceptionally useful for data visualization. When you represent a server stack, a supply chain pipeline, or a tiered pricing model in isometric view, the viewer can accurately judge relative sizes and proportions without the distortion found in standard 3D rendering. This clarity is essential when accuracy matters as much as aesthetics.
Beyond mere accuracy, the aesthetic appeal of isometric design lies in its ability to organize chaos. Complex systems look cleaner when mapped onto an isometric grid. For marketers and content creators, this style signals innovation and technical competence. It moves away from the overused flat design trends of the last decade while avoiding the uncanny valley of hyper-realistic 3D renders. It strikes a balance that feels engineered yet approachable, making it ideal for B2B communications where trust and professionalism are the primary goals.
Technical Specifications and File Utility
Understanding the technical delivery of this asset pack is vital for integrating it into your existing workflow. The product contains one EPS10 file, which serves as the master source. EPS10 is a widely supported vector format compatible with Adobe Illustrator, CorelDRAW, Affinity Designer, and various open-source alternatives like Inkscape. Because it is vector-based, you can scale individual elements from the size of a postage stamp to a billboard without any loss of quality or pixelation. This scalability ensures that your charts remain crisp whether they are viewed on a mobile device or projected in a conference hall.
Additionally, the package includes a 72ppi resolution JPEG preview. While this raster image is not intended for final production use, it serves an important role in asset management. It allows you to quickly browse the contents of the library within your operating system’s file explorer or digital asset management software without needing to launch heavy vector editing applications. This small inclusion significantly speeds up the selection process when you are working under tight deadlines and need to verify that the collection contains the specific chart type or icon you require before opening the master file.
Practical Applications Across Industries
The versatility of Infographic Isometric Elements extends far beyond simple decoration. Different professionals leverage these assets to solve distinct communication problems:
- Financial Analysts and Consultants: Use isometric stacks and pillars to visualize compound interest, revenue growth, or budget allocation. The 3D effect allows for the representation of multiple variables simultaneously, such as time, volume, and category, within a single cohesive graphic.
- SaaS Product Managers: Explain software architecture and user journeys. Isometric layouts are perfect for showing how different modules of a platform interact, turning abstract API connections into tangible visual metaphors that stakeholders can grasp immediately.
- Educators and Trainers: Create engaging course materials for adult learners. Breaking down theoretical concepts into structured visual diagrams improves retention rates and reduces cognitive load during lectures or self-paced study sessions.
- Digital Marketers: Enhance blog posts and whitepapers. Custom isometric graphics increase time-on-page metrics and social shares compared to stock photography, as they offer unique value and specific relevance to the accompanying text.
- Startup Founders: Elevate pitch decks. Investors review hundreds of decks monthly; consistent, high-quality isometric visuals demonstrate attention to detail and help differentiate your narrative from competitors using template-based slides.
Customization and Brand Integration
One of the strongest benefits of owning the EPS10 source file is the ability to fully customize the Infographic Isometric Elements to match your brand identity. Out-of-the-box colors rarely align perfectly with corporate style guides. With vector access, you can recolor every element to match your specific hex codes, adjust stroke weights to align with your typography, and modify opacity levels to create hierarchy. This level of control ensures that your data visualizations feel like a native extension of your brand rather than an afterthought.
Furthermore, modularity is key to long-term utility. These elements are typically constructed as separate objects or grouped layers. You can deconstruct a complex diagram to reuse individual components elsewhere, or combine elements from different sections to create entirely new configurations. This modular approach maximizes the return on investment for the asset pack, allowing a single purchase to generate dozens of unique visuals over months or years of projects.
Evaluating Fit for Your Workflow
Before incorporating these elements into your next project, consider your team's technical capabilities and the specific nature of your data. Isometric design requires a certain level of spatial reasoning to arrange effectively. If your team lacks experience with vector manipulation, allocate time for learning how to snap objects to isometric grids and manage layer ordering. Poorly assembled isometric art can look disjointed, so maintaining consistent angles and lighting direction is non-negotiable for professional results.
Also, assess whether the abstraction level matches your audience's needs. While Infographic Isometric Elements excel at conceptual and systemic visualization, they may not be suitable for precise scientific plotting or highly emotional storytelling. They are tools for structural clarity and business logic. When used appropriately, they streamline the design process by providing pre-built foundations, but they still require thoughtful curation and arrangement to communicate effectively.
Ultimately, this collection offers a pragmatic solution for professionals who need to elevate their visual communication without commissioning custom 3D renders for every project. The combination of editable vector flexibility and immediate preview accessibility makes it a functional addition to any creative or analytical toolkit. By focusing on clarity, scalability, and professional application, these elements help transform abstract numbers into compelling narratives that drive decision-making and engagement.