M2M Communication Vector Infographic Design Guide
Visualizing the invisible exchange of data between devices requires a specific design language. The M2M Communication Vector Infographic template serves as a comprehensive visual framework for translating complex machine-to-machine interactions into clear, digestible graphics. Unlike standard decorative vectors, this asset is engineered specifically for technical storytelling. It combines linear iconography with structured workflow layouts to map out processes that are typically abstract. For designers and marketers tasked with explaining IoT ecosystems, inventory systems, or automated data collection, this template provides the necessary scaffolding to turn raw specifications into professional presentation materials.
The visual personality of this infographic kit leans heavily into modern minimalism and technical precision. It avoids unnecessary ornamentation in favor of clean lines and geometric consistency. This aesthetic is intentional; when presenting data regarding automated systems or sensor networks, clarity must always supersede decoration. The style communicates reliability and efficiency, mirroring the very technology it depicts. Whether you are designing a white paper for an engineering firm or a pitch deck for a logistics startup, the vector set maintains a professional tone that builds trust with stakeholders who value accuracy over flair.
Structuring Complex Data with Five-Step Visualization
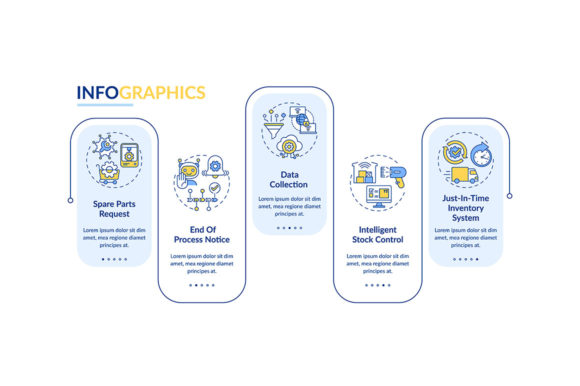
One of the most practical applications of this template is its pre-configured five-step data visualization layout. In technical communication, breaking down a continuous process into discrete stages is essential for audience comprehension. This specific structure works exceptionally well for illustrating the lifecycle of M2M communication: data generation at the sensor level, transmission through gateways, cloud processing, analytics, and finally, actionable feedback loops. Rather than building these diagrams from scratch, which often leads to inconsistent spacing and alignment issues, the template offers a unified grid system.
This structured approach directly influences information hierarchy. By using consistent linear icons for each step, viewers can quickly scan the graphic to understand the flow without getting bogged down in dense text. For content creators and publishers, this means higher engagement rates on technical articles or reports. Readers are more likely to absorb key concepts when they are presented visually. Furthermore, the five-step model is versatile enough to be adapted for non-M2M topics, such as customer onboarding workflows or supply chain audits, making it a high-value asset in any designer’s library.
Process Timelines and Inventory System Presentation
Beyond simple step-by-step guides, the M2M Communication Vector Infographic excels at depicting temporal relationships through process timeline charts. Time is a critical variable in machine communication, where latency and synchronization define system performance. The included timeline elements allow designers to visualize sequential events or parallel processing streams effectively. This is particularly useful for inventory system presentations where tracking items from warehouse entry to point-of-sale involves multiple automated checkpoints. The linear nature of the icons ensures that even dense timelines remain legible on both large projection screens and mobile devices.
For entrepreneurs and small business owners managing smart retail or manufacturing operations, these visuals bridge the gap between operational reality and strategic planning. A well-designed timeline can highlight bottlenecks in an automated sorting facility or demonstrate the efficiency gains of a new RFID implementation. The template supports this narrative by providing modular components that can be rearranged to fit specific case studies. This flexibility allows for rapid iteration during the design phase, enabling teams to test different visual arrangements before finalizing their presentations.
Technical Specifications and File Format Versatility
A significant advantage of this design asset is its comprehensive file format inclusion. The ZIP package contains EPS, JPG, PNG, SVG, AI, and other vector-friendly formats. Understanding when to use each format is crucial for maintaining quality across different media. The AI and EPS files serve as the master sources for print production and extensive editing in Adobe Illustrator. These formats preserve the mathematical precision of the vectors, ensuring crisp edges at any scale, from business cards to billboards. For web design and digital publishing, the SVG format is indispensable. It offers scalability without file bloat and can be styled with CSS to match brand colors dynamically.
The raster formats (JPG and PNG) provide immediate utility for social media graphics, blog headers, or quick mockups where vector editing software isn't available. PNGs with transparent backgrounds are especially valuable for overlaying infographic elements onto existing slide decks or website layouts. This multi-format delivery ensures that the asset remains accessible regardless of the user's technical proficiency or software ecosystem. Marketers can grab a PNG for a LinkedIn post while the design team simultaneously refines the AI file for an annual report, streamlining cross-functional collaboration.
Integrating Linear Icons into Brand Identity Systems
While primarily an infographic tool, the linear icons included in this template have broader applications in brand identity and UI design. Their uniform stroke weight and geometric construction make them excellent candidates for creating a cohesive visual language across digital products. When designing interfaces for IoT dashboards or inventory management apps, consistency in iconography reduces cognitive load for users. Adopting the style from this M2M Communication Vector Infographic ensures that your interface elements align perfectly with your marketing collateral and technical documentation.
Designers should evaluate how these icons pair with existing typography. Because the vectors are minimalist and sans-serif in nature, they pair best with modern grotesque or neo-grotesque typefaces. Avoid ornate serif fonts or handwritten scripts, as the stylistic clash can undermine the technical authority of the design. Testing font pairings early in the project prevents visual dissonance. Additionally, consider the negative space within the icons; adequate padding is necessary to maintain legibility at smaller sizes. This attention to detail elevates the perceived professionalism of the final output.
Practical Considerations for Commercial Application
Before deploying this template in commercial projects, it is vital to review licensing terms and customization requirements. While the template provides a strong foundation, successful implementation requires adaptation to specific brand guidelines. Color palettes should be adjusted to match corporate identity, but care must be taken to maintain sufficient contrast for accessibility. Technical diagrams often fail WCAG standards due to low-contrast greys; utilizing darker strokes against light backgrounds ensures readability for all users. This inclusivity is not just ethical but also expands the potential reach of your content.
Furthermore, consider the context of the end viewer. An engineer reviewing a spec sheet needs different levels of detail than a CEO reviewing a quarterly summary. The modularity of the M2M Communication Vector Infographic allows for the creation of tiered visuals. Create a simplified version for executive summaries using only the primary workflow icons, and reserve the detailed timeline charts for technical appendices. This strategic use of design assets maximizes their value across the organization. By treating this template as a flexible system rather than a static image, creative professionals can produce consistent, high-quality visualizations that drive understanding and decision-making in the rapidly evolving field of machine-to-machine technology.